GOAL
- automated emails sent to providers
- primarily for informational purposes (statistics, activities etc.)
IDEAS
- that people for example are clicking on their courses and enrolling
- this could be that they select I want weekly or monthly reports - how many courses, how many people clicked enroll, visiting their profile,etc - and maybe trends etc
- it could be information how many courses were added in general and which competence is trending - based on the current mappings
Outputs:
- Periods - Weekly and monthly reports
- providers can select weekly or monthly report or both
- SkillsHub statistics data
- how many courses / job roles were added
- clicks and enrolls number overview for provider courses
- which competences are trending (based on the current mappings)
- which courses are trending (based on clicking)
Plan:
Providers can select:
- Weekly reports
- Monthly reports
- Both report types
- Default is biannual
- templates:
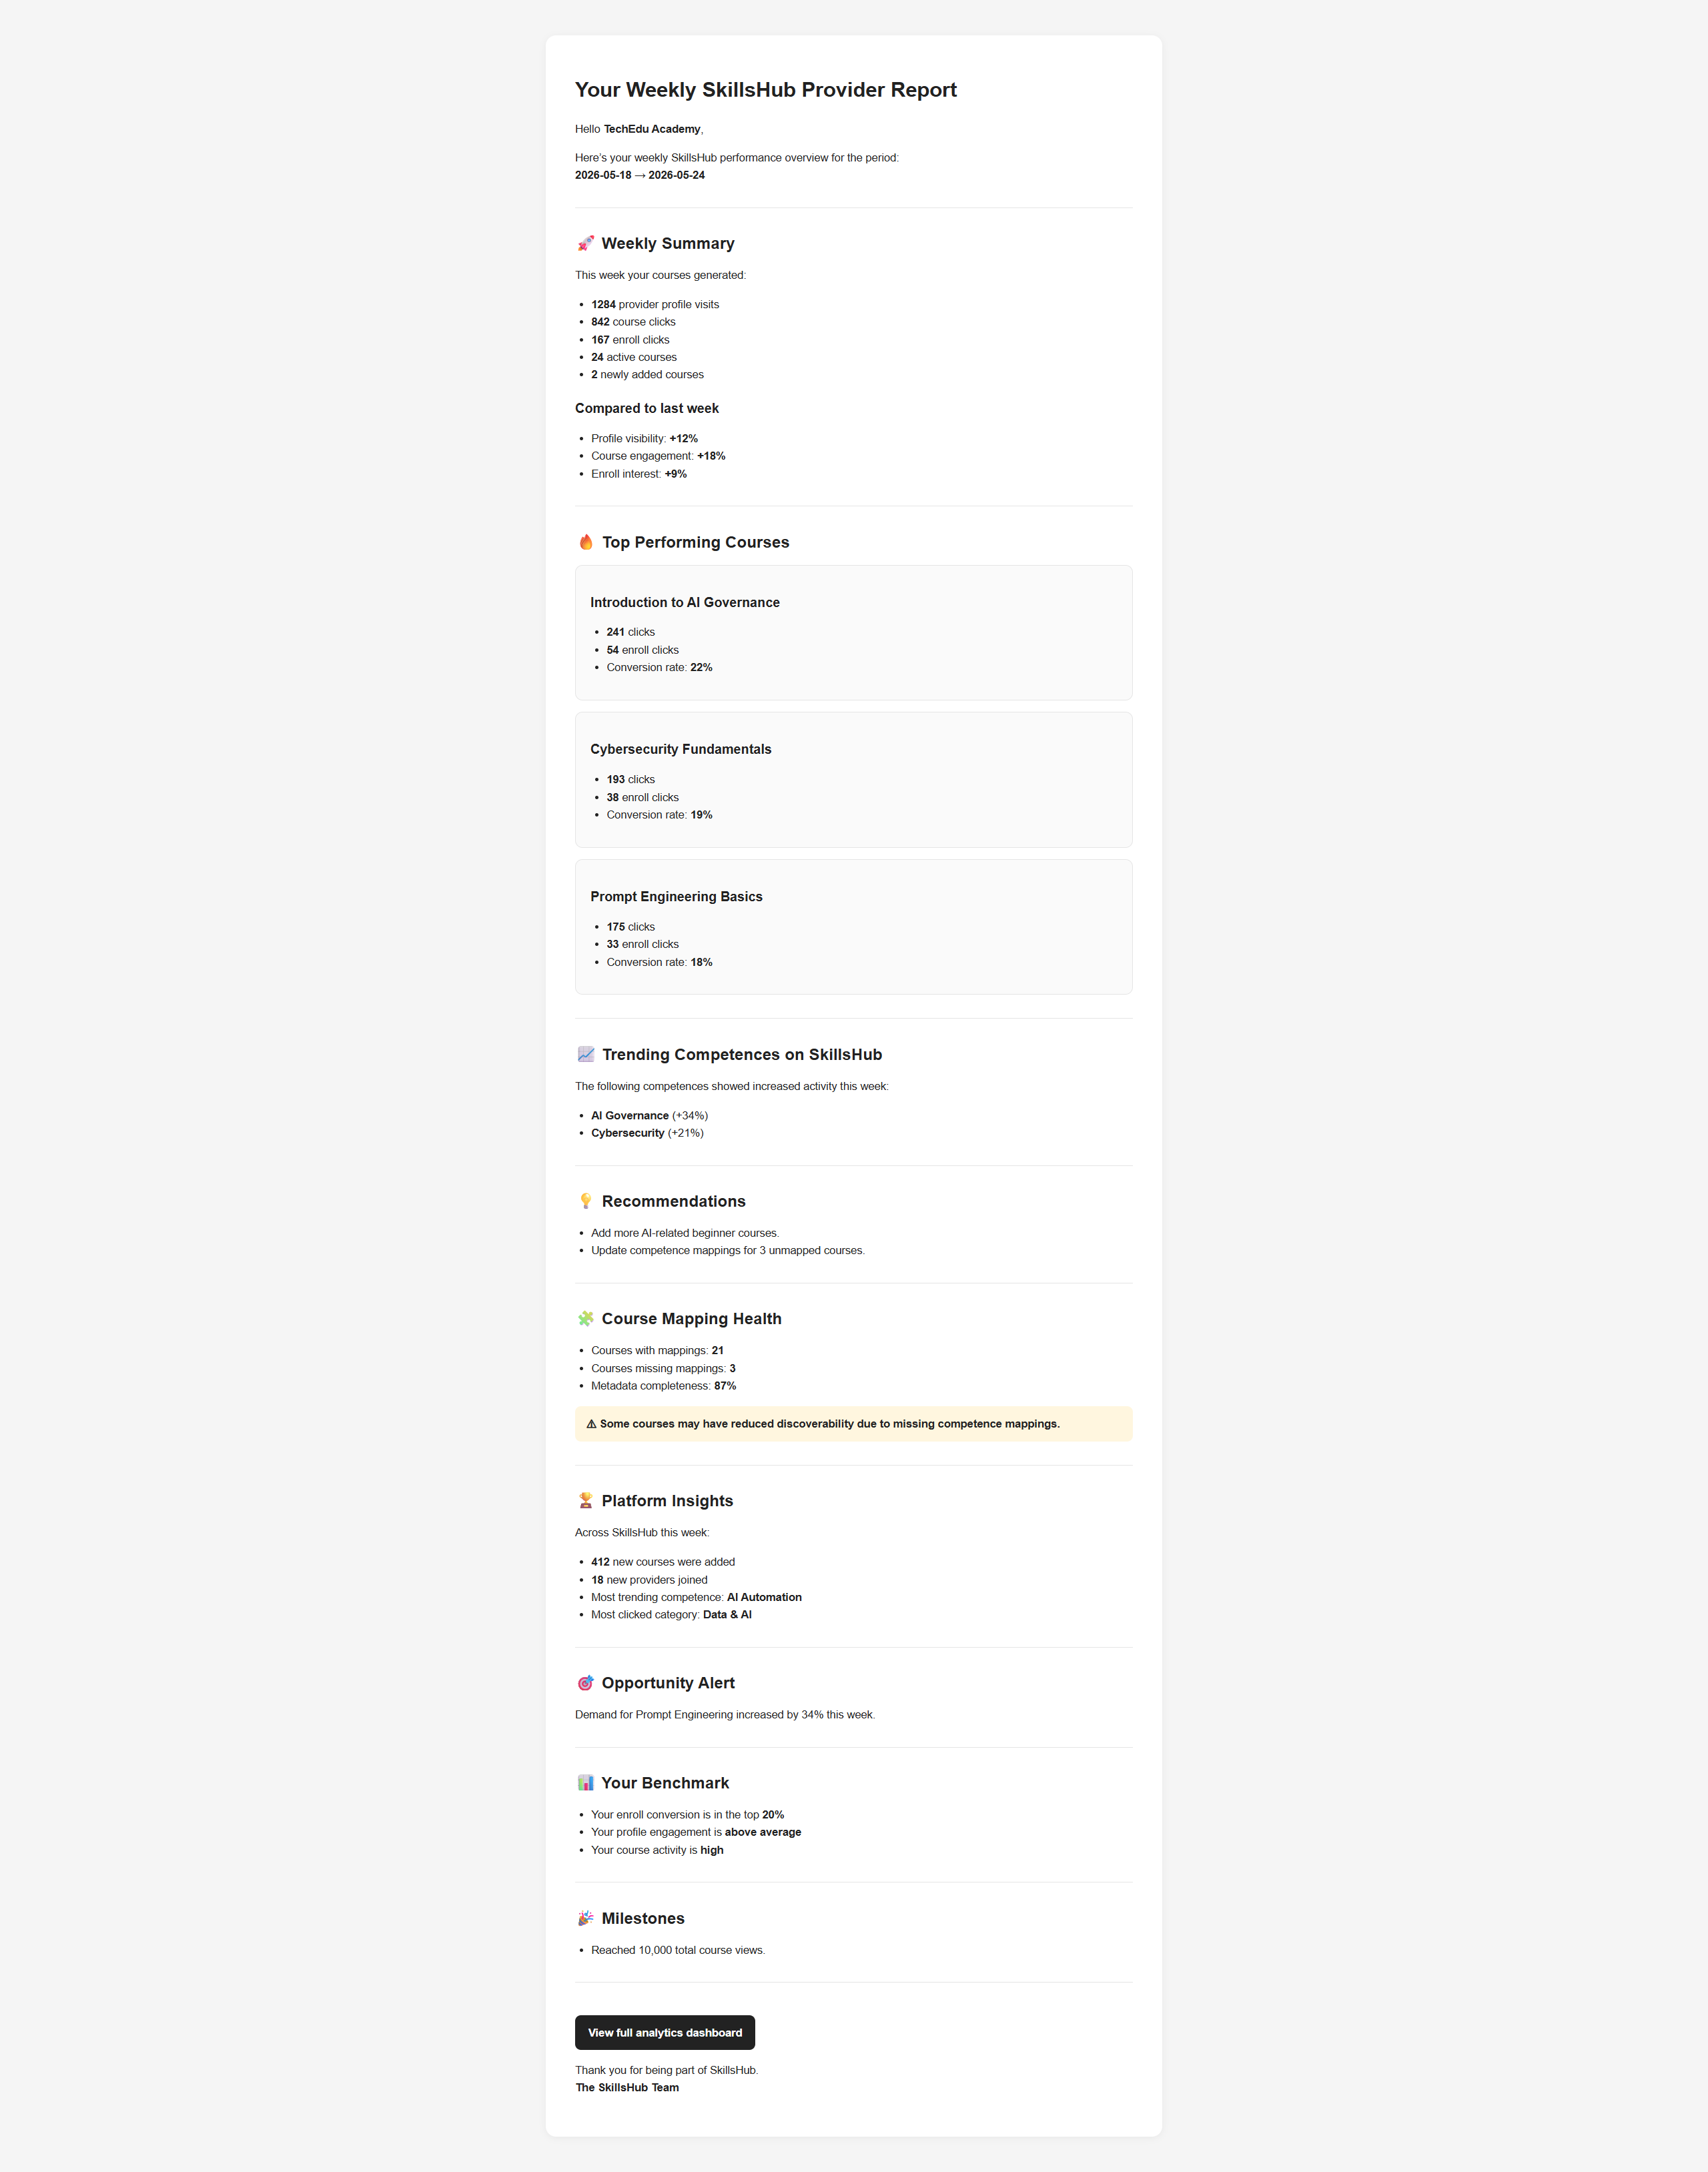
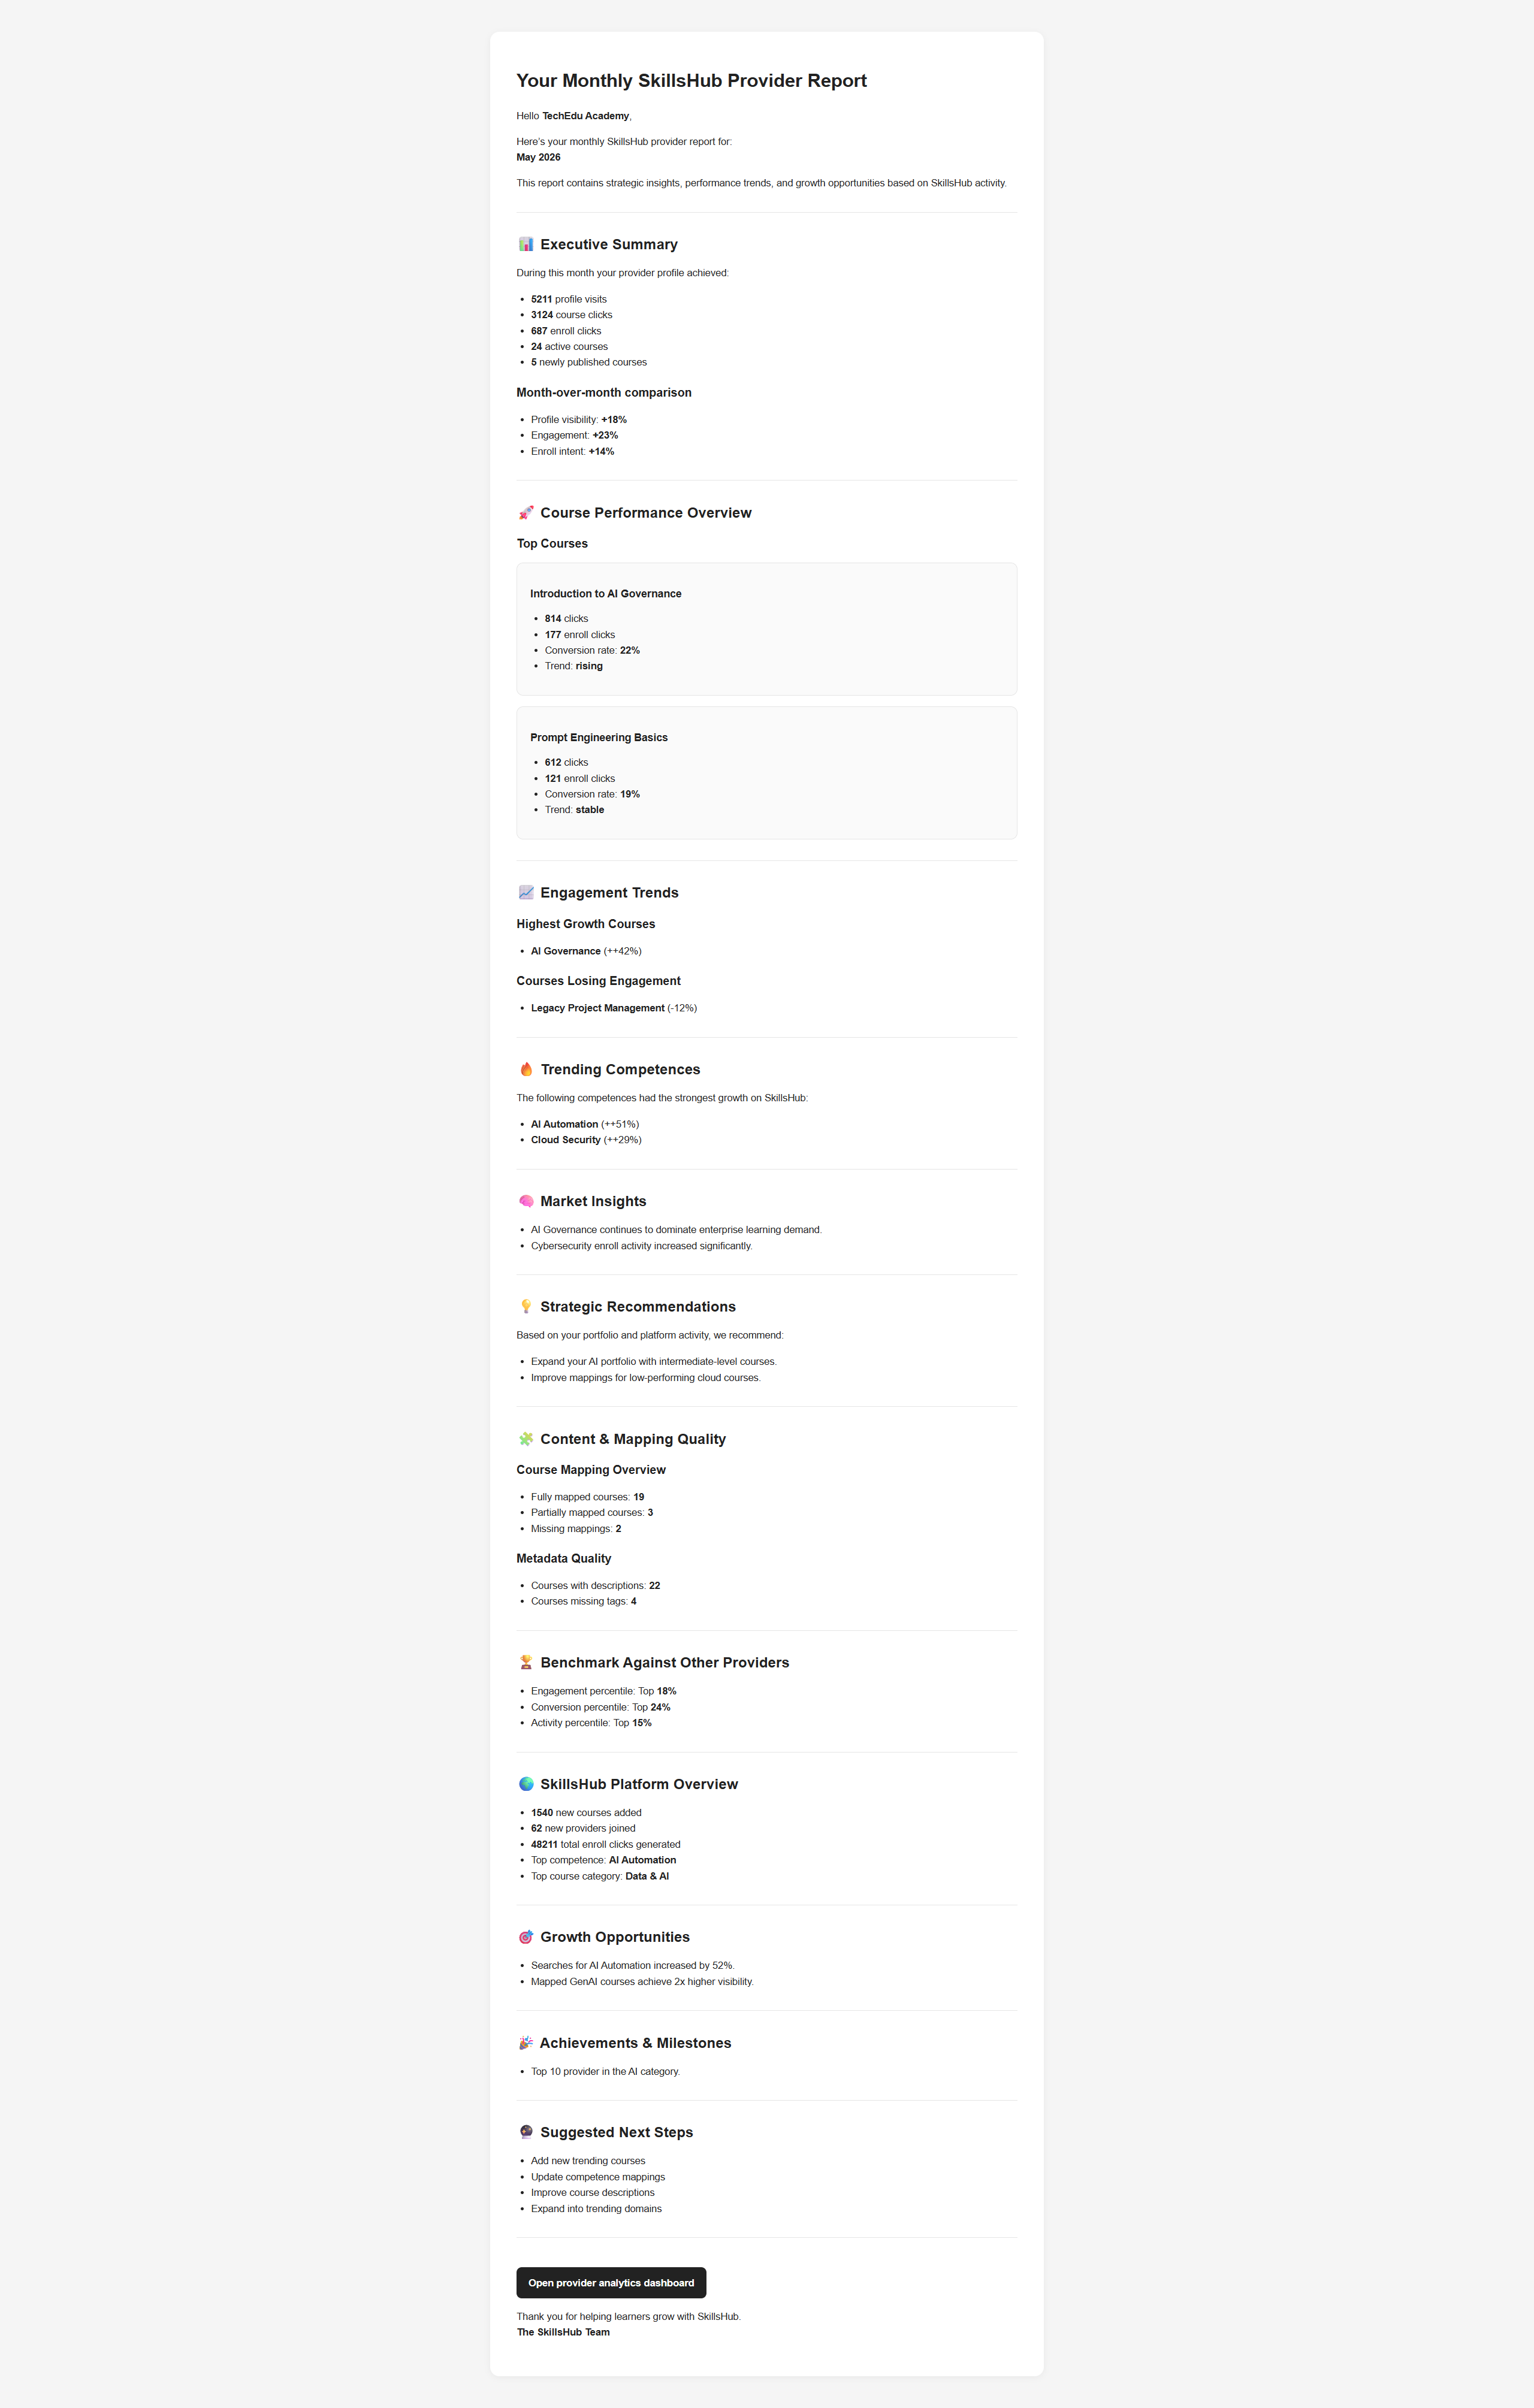
- We have prototypes
- Process: Calculate data -> Save permanently -> Display on the dashboard -> Send via email (based on their report settings—weekly/monthly, default is every six months)
- Then some gamification as well
- Leaderboard—ranking all providers based on a composite index (number of courses, number of mapped competencies, number of credentials, number of views, number of enrollments)
- A separate module for this on BE
¶ PROVIDER CARE
Snapshots
- new table ProviderStatisticalSnapshot
- snapshots are created at the end of each day for each provider
- to capture the state of provider trainings (active/draft, mapped/unmapped)
- so it is possible to see what the state looked like on a specific day
- attributes:
- id (PK)
- providerId (FK)
- snapshotDate
- createdAt
- activeMappedTrainingsCount
- activeUnmappedTrainingsCount
- draftMappedTrainingsCount
- draftUnmappedTrainingsCount
- attributes:
Report calculations
1. Provider overview
- profileVisits
- provider profile visits - count of
ProviderMetricsProfileViewrecords for the provider within the selected time period
- provider profile visits - count of
- trainingViews
- clicks to training detail page - count of
TrainingMetricsViewrecords for trainings belonging to the provider within the selected time period
- clicks to training detail page - count of
- trainingEnrolls
- clicks to training enroll (external link) - count of
TrainingMetricsEnrollrecords for trainings belonging to the provider within the selected time period
- clicks to training enroll (external link) - count of
- newTrainings
- trainings created in given period - count of
Trainingrecords with createdAt within the selected time period
- trainings created in given period - count of
- publishedTrainings
- trainings published in given period - count of
Trainingrecords with publishedAt within the selected time period
- trainings published in given period - count of
comparing with previous report
- profileVisitsGrowthPct - percentage growth in profileVisits compared with the previous equivalent reporting period
- trainingViewsGrowthPct - percentage growth in trainingViews compared with the previous equivalent reporting period
- trainingEnrollsGrowthPct - percentage growth in trainingEnrolls compared with the previous equivalent reporting period
mappings
- mappedTrainingsCount - current number of this provider's non-deleted trainings mapped to at least one competence
- unmappedTrainingsCount - current number of this provider's non-deleted trainings without any competence mapping
TOP N TRAININGS
N is set to 3
each card has these attributes:
- training name
- views (count in given period)
- enrolls (count in given period)
- ctr (calculated from views and enrolls)
BENCHMARKS
- enrollConversion
- Measures what percentage of this provider's training views converted into enroll clicks during the reporting period.
- Formula: trainingEnrolls / trainingViews * 100, rounded to two decimals. If trainingViews == 0, value is 0.0 and label is NO_DATA.
- trainingActivity
- Measures how actively the provider created and published trainings during the reporting period, with published/active trainings weighted higher than draft-only new trainings.
- Formula: activeTrainings * 3 + max(newTrainings - activeTrainings, 0). If newTrainings == 0 and activeTrainings == 0, value is 0.0 and label is NO_DATA.
profileEngagementMeasures how well provider profile traffic turns into training interest (trainingViews / profileVisits * 100).- It is only possible if we track where the training view originated from and if the training list is displayed on the provider profile at all.
- convertion to label
- percentile >= 80 -> top 20%
percentile >= 60 -> nadprůměrný
percentile >= 40 -> průměrný
percentile < 40 -> podprůměrný
- percentile >= 80 -> top 20%
MILESTONES
monitored metrics:
- provider's training views
- provider's training enrolls
- provider's active trainings
milestone thresholds
- 10, 50, 150, 200, 250, 300, 350, 400, 500, 600, 700, 800, 900, 1000, 1250, 1500, 1750, 2000
RECOMMENDATIONS
- TODO
- proposals - which courses should you map, whether there's anything you still need to complete etc.
OPPORTUNITIES
- TODO
2. Platform overview
TRENDING SKILLS
- growthPct - the number of times this skill was mapped to a training in the previous period and how many times in the current period, then calculates the increase/decrease in the number of mapping (using
SCKToTrainingand its mappedAt) - 3 skills with the biggest increases are shown
PLATFROM OVERVIEW
- TODO rework
- newTrainings
- newProviders
- mostViewedCompetenceName (CHANGE TO mostViewedJobRoleName)
- mostViewedCategoryName (CHANGE TO ..)